In-depth Windows Telemetry
An article on targeting Windows Telemetry, focusing on manipulating Event Tracing for Windows (ETW) to evade detection and disable telemetry sources.
Event Tracing for Windows (ETW) is a high-performance logging framework used for monitoring and debugging system and application activity. It is structured around providers, sessions, and consumers:
- Controllers decide when event tracing sessions begin or end, enabling specific providers.
- Providers generate event data and are identified by unique GUIDs.
- Sessions collect and store event logs, managed by the Event Logging API.
- Consumers process and analyze the collected data in real-time or from stored logs.
Security solutions such as EDRs leverage ETW to gather insights into system activity, detect malicious behaviors, and perform forensic analysis. ETW events provide rich telemetry, including process execution, network connections, DLL loading, and kernel-level activity. EDRs typically monitor key ETW providers, such as Microsoft-Windows-Security-Auditing and Microsoft-Windows-Kernel-Process, to track suspicious activity and correlate threat intelligence.
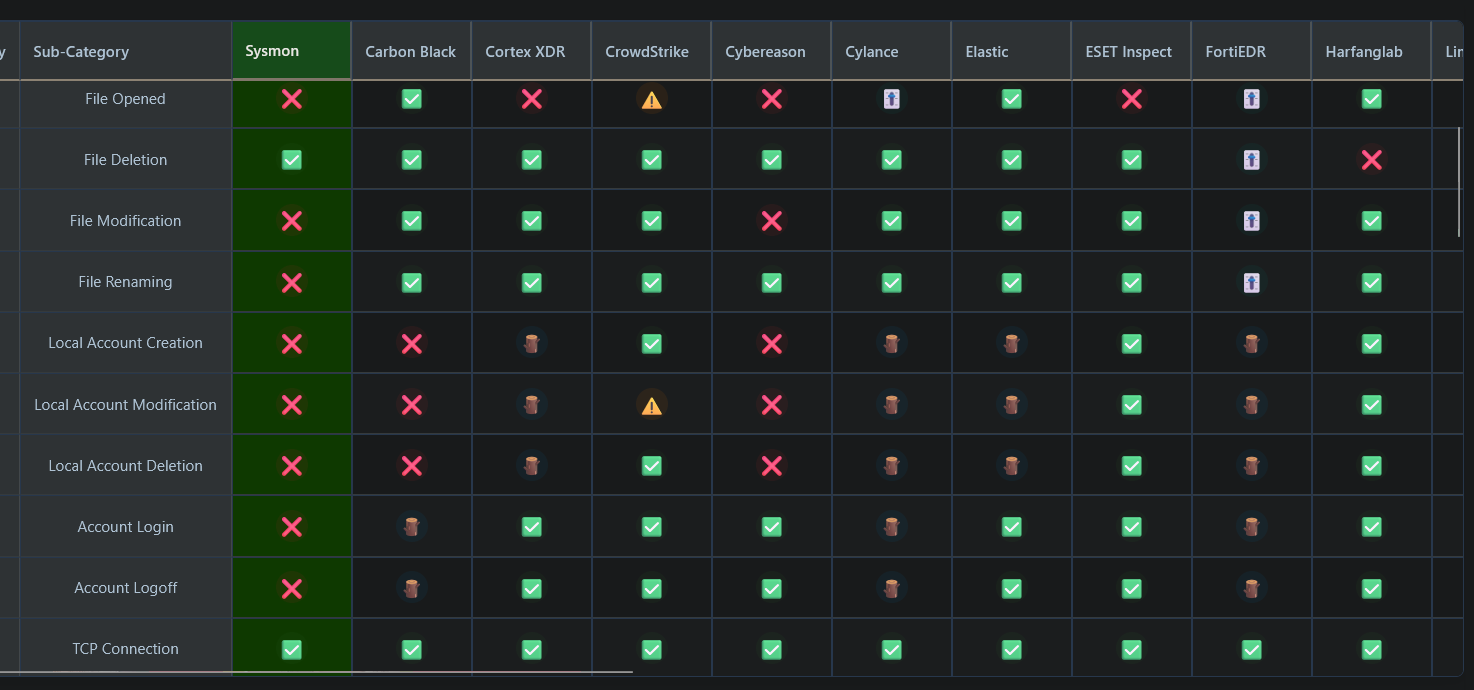
As shown by all the log emojis in this table (source), some security solutions rely heavily on ETW to consume telemetry for detections.
We will focus on ETW providers as they generate data for the consumers to... well... consume, making them a premium target if we decide to mess with this functionality.
ETW Providers from User-Land
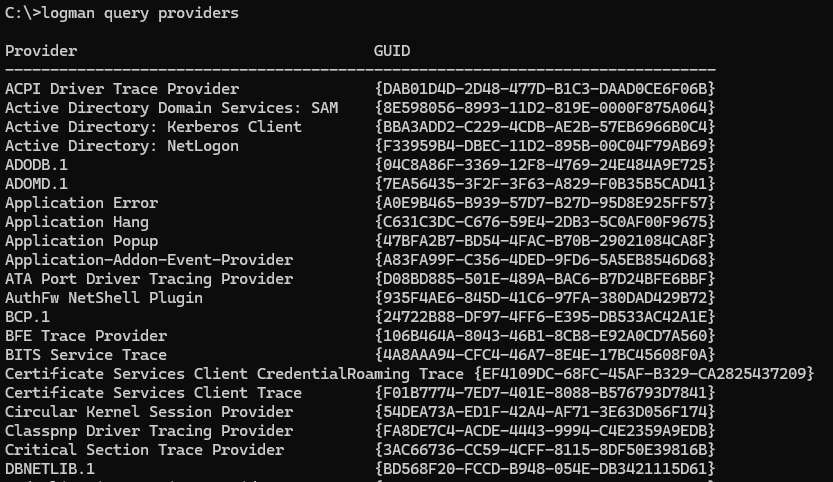
From a typical user-space perspective, ETW providers can be enumerated using utilities like logman; the following command lists all active ETW providers and their GUIDs
logman query providers
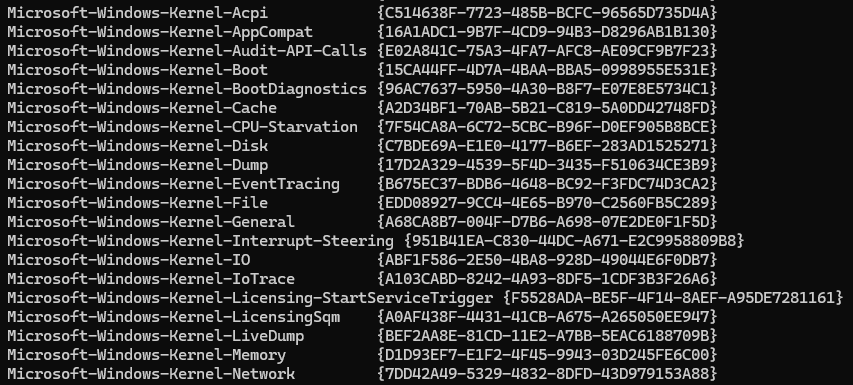
In this list, we can also spot the most interesting entries - namely the Microsoft-Windows-Kernel-* family: these providers are responsible for monitoring low-level system activity by generating telemetry about process execution, thread activity, memory management, network activity, and driver interaction.
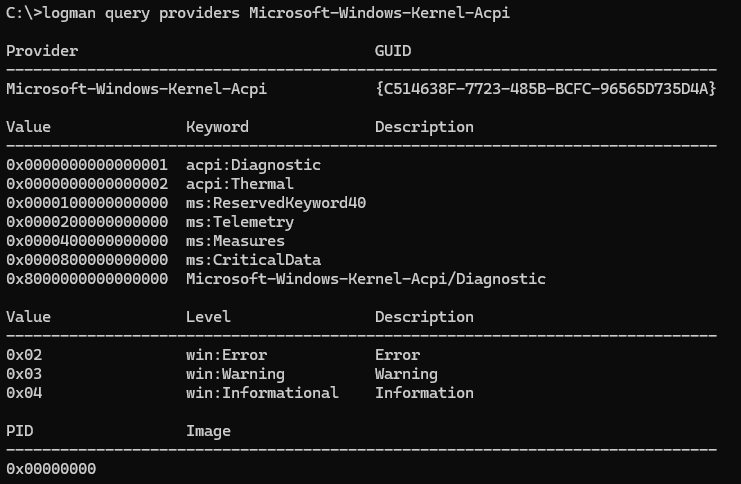
If we try to query for more information about these entries we'll notice that the PID associated with them is 0x0, signifying that these providers are executed by the OS directly.
logman query providers Microsoft-Windows-Kernel-Acpi
ETW Providers from Kernel-Land
Speaking of kernel, what do these objects look like in memory? The main structures we will focus on are
-
_ETW_SILODRIVERSTATE(Vergilius Project) -
_WMI_LOGGER_CONTEXT(Vergilius Project) -
_ETW_GUID_ENTRY(Vergilius Project)
These kernel structures store data about ETW providers and can be easily accessed for debugging purposes by attaching something like WinDbg to the local kernel. In this section, we'll go through how we can find these in memory and traverse them to gather information about the objects within the structures.
At the top level, we have the _ETW_SILODRIVERSTATE structure. SILOs refer to isolated execution environments used primarily for containerized processes and job objects. A SILO provides process and resource isolation within the Windows kernel, which is particularly useful in scenarios such as Windows Server Containers and application sandboxes. The _ETW_SILODRIVERSTATE structure maintains information about the state of processes running within a SILO, ensuring that event logging and tracing work properly even in containerized environments.
To locate these structures in memory, we can query the EtwpDebuggerData symbol, which contains a list of _ETW_SILODRIVERSTATE structures:
lkd> dq nt!EtwpDebuggerData
fffff800`7c80b4b8  e80c3804`082c0220 50040c88`106000c8
fffff800`7c80b4c8  ffffe08d`a27e6740 ffffe08d`a27e7000
fffff800`7c80b4d8  00000000`00000000 00000102`00000000
fffff800`7c80b4e8  0000e0ff`00000002 00000000`00000000
fffff800`7c80b4f8  00000000`00000000 00000006`0000000f
fffff800`7c80b508  0000014a`00000240 00000000`00000101
fffff800`7c80b518  00000000`00000000 00000394`000003a8
fffff800`7c80b528  00000032`00000030 0000001b`00000000
From here, we can parse and dereference the appropriate pointers to examine specific entries like EtwpLoggerContext (a pointer to a _WMI_LOGGER_CONTEXT structure) and EtwpGuidHashTable (a pointer to an array of hash buckets, each holding _ETW_GUID_ENTRY lists).
lkd> dt nt!_ETW_SILODRIVERSTATE ffffe08d`a27e7000
   +0x000 Silo             : (null)
   +0x008 SiloGlobals      : 0xfffff800`7c9489c0 _ESERVERSILO_GLOBALS
   +0x010 MaxLoggers       : 0x50
   +0x018 EtwpSecurityProviderGuidEntry : _ETW_GUID_ENTRY
   +0x1c0 EtwpLoggerRundown : 0xffffe08d`a27e64c0  -> 0xffffe08d`a23fd5a0 _EX_RUNDOWN_REF_CACHE_AWARE
   +0x1c8 EtwpLoggerContext : 0xffffe08d`a27e6740  -> 0x00000000`00000001 _WMI_LOGGER_CONTEXT
   +0x1d0 EtwpGuidHashTable : [64] _ETW_HASH_BUCKET
   +0xfd0 EtwpSecurityLoggers : [8] 3
   +0xfe0 EtwpSecurityProviderEnableMask : 0x7 ''
   +0xfe4 EtwpShutdownInProgress : 0n0
   +0xfe8 EtwpSecurityProviderPID : 0x5b4
   +0xff0 PrivHandleDemuxTable : _ETW_PRIV_HANDLE_DEMUX_TABLE
   +0x1010 RTBacklogFileRoot : (null)
   +0x1018 EtwpCounters     : _ETW_COUNTERS
   +0x1028 LogfileBytesWritten : _LARGE_INTEGER 0x00000001`9ed002f8
   +0x1030 ProcessorBlocks  : (null)
   +0x1038 ContainerStateWnfSubscription : 0xffff890e`06e5d3f0 _EX_WNF_SUBSCRIPTION
   +0x1040 ContainerStateWnfCallbackCalled : 0
   +0x1048 UnsubscribeWorkItem : 0xffff890e`06c392b0 _WORK_QUEUE_ITEM
   +0x1050 PartitionId      : _GUID {00000000-0000-0000-0000-000000000000}
   +0x1060 ParentId         : _GUID {00000000-0000-0000-0000-000000000000}
   +0x1070 QpcOffsetFromRoot : _LARGE_INTEGER 0x0
   +0x1078 PartitionName    : (null)
   +0x1080 PartitionNameSize : 0
   +0x1082 UnusedPadding    : 0
   +0x1084 PartitionType    : 0
   +0x1088 SystemLoggerSettings : _ETW_SYSTEM_LOGGER_SETTINGS
   +0x1200 EtwpStartTraceMutex : _KMUTANT
These structures can be a bit overwhelming at first, but we are only interested in a couple of attributes.
-
EtwpLoggerContext: attribute of type_WMI_LOGGER_CONTEXT, this structure is the kernel's representation of an event tracing session. For most loggers (every logger except auto-loggers), this structure is created and populated as soon as a logger is started and deleted when the logger is stopped. -
EtwpGuidHashTable: attribute of type_ETW_GUID_ENTRY, a triple linked list containing_ETW_GUID_ENTRYelements. Each entry represents an individual ETW provider; the GUID contained in this structure is the same as we can find by querying the ETW providers throughlogmanand can be used to navigate the hash tables by calculating the index of the hash bucket inside the structure.
As you might've noticed, the size of the EtwpGuidHashTable attribute is fixed to 64; this is because Event Tracing supports a maximum of 64 event tracing sessions executing simultaneously with the exception of the Global Logger Session and NT Kernel Logger Session which are considered "special purpose sessions".
lkd> dx -id 0,0,ffffe08da20fe040 -r1 (*((ntkrnlmp!_ETW_HASH_BUCKET (*)[64])0xffffe08da27e71d0))
(*((ntkrnlmp!_ETW_HASH_BUCKET (*)[64])0xffffe08da27e71d0))                 [Type: _ETW_HASH_BUCKET [64]]
    [0]              [Type: _ETW_HASH_BUCKET]
    [1]              [Type: _ETW_HASH_BUCKET]
    [2]              [Type: _ETW_HASH_BUCKET]
    [3]              [Type: _ETW_HASH_BUCKET]
    [4]              [Type: _ETW_HASH_BUCKET]
    [5]              [Type: _ETW_HASH_BUCKET]
    [6]              [Type: _ETW_HASH_BUCKET]
    [7]              [Type: _ETW_HASH_BUCKET]
    [8]              [Type: _ETW_HASH_BUCKET]

	...

    [60]             [Type: _ETW_HASH_BUCKET]
    [61]             [Type: _ETW_HASH_BUCKET]
    [62]             [Type: _ETW_HASH_BUCKET]
    [63]             [Type: _ETW_HASH_BUCKET]
Traversing one of the 64 entries in the list we can get information about a single ETW provider.
_ETW_HASH_BUCKET entry -> ListHead -> any of the 3 _LIST_ENTRY objects
In the debugger, it looks something like this
lkd> dx -id 0,0,ffffe08da20fe040 -r1 (*((ntkrnlmp!_ETW_HASH_BUCKET *)0xffffe08da27e71d0))
(*((ntkrnlmp!_ETW_HASH_BUCKET *)0xffffe08da27e71d0))                 [Type: _ETW_HASH_BUCKET]
    [+0x000] ListHead         [Type: _LIST_ENTRY [3]]
    [+0x030] BucketLock       [Type: _EX_PUSH_LOCK]
lkd> dx -id 0,0,ffffe08da20fe040 -r1 (*((ntkrnlmp!_LIST_ENTRY (*)[3])0xffffe08da27e71d0))
(*((ntkrnlmp!_LIST_ENTRY (*)[3])0xffffe08da27e71d0))                 [Type: _LIST_ENTRY [3]]
    [0]              [Type: _LIST_ENTRY]
    [1]              [Type: _LIST_ENTRY]
    [2]              [Type: _LIST_ENTRY]
lkd> dx -id 0,0,ffffe08da20fe040 -r1 (*((ntkrnlmp!_LIST_ENTRY *)0xffffe08da27e71d0))
(*((ntkrnlmp!_LIST_ENTRY *)0xffffe08da27e71d0))                 [Type: _LIST_ENTRY]
    [+0x000] Flink            : 0xffffe08dda446460 [Type: _LIST_ENTRY *]
    [+0x008] Blink            : 0xffffe08da20c01d0 [Type: _LIST_ENTRY *]
lkd> dt nt!_ETW_GUID_ENTRY 0xffffe08dda446460
   +0x000 GuidList         : _LIST_ENTRY [ 0xffffe08d`aa49d3d0 - 0xffffe08d`a27e71d0 ]
   +0x010 SiloGuidList     : _LIST_ENTRY [ 0xffffe08d`da446470 - 0xffffe08d`da446470 ]
   +0x020 RefCount         : 0n1
   +0x028 Guid             : _GUID {2d4ebca6-ea64-453f-a292-ae2ea0ee513b}
   +0x038 RegListHead      : _LIST_ENTRY [ 0xffffe08d`d9db3490 - 0xffffe08d`d9db3490 ]
   +0x048 SecurityDescriptor : 0xffff890e`06a39a60 Void
   +0x050 LastEnable       : _ETW_LAST_ENABLE_INFO
   +0x050 MatchId          : 0
   +0x060 ProviderEnableInfo : _TRACE_ENABLE_INFO
   +0x080 EnableInfo       : [8] _TRACE_ENABLE_INFO
   +0x180 FilterData       : (null)
   +0x188 SiloState        : 0xffffe08d`a27e7000 _ETW_SILODRIVERSTATE
   +0x190 HostEntry        : (null)
   +0x198 Lock             : _EX_PUSH_LOCK
   +0x1a0 LockOwner        : (null)
As shown above, the _ETW_GUID_ENTRY structure contains the GUID of the provider, information about its position in the linked list, and details about the state of the SILO and the provider itself.
The most interesting among these attributes is EnableInfo as the _TRACE_ENABLE_INFO structure contains a single value called IsEnabled that dictates whether the provider is able to generate telemetry or not. The example below shows a value of 0x0 meaning that the provider is disabled.
This value is a gold mine for an attacker as flipping a single bit in memory can completely disable a source of telemetry.
lkd> dx -id 0,0,ffffe08da20fe040 -r1 (*((ntkrnlmp!_TRACE_ENABLE_INFO *)0xffffe08dda4464c0))
(*((ntkrnlmp!_TRACE_ENABLE_INFO *)0xffffe08dda4464c0))                 [Type: _TRACE_ENABLE_INFO]
    [+0x000] IsEnabled        : 0x0 [Type: unsigned long]
    [+0x004] Level            : 0x0 [Type: unsigned char]
    [+0x005] Reserved1        : 0x0 [Type: unsigned char]
    [+0x006] LoggerId         : 0x0 [Type: unsigned short]
    [+0x008] EnableProperty   : 0x0 [Type: unsigned long]
    [+0x00c] Reserved2        : 0x0 [Type: unsigned long]
    [+0x010] MatchAnyKeyword  : 0x0 [Type: unsigned __int64]
    [+0x018] MatchAllKeyword  : 0x0 [Type: unsigned __int64]
But are all the ETW providers accessible and visible from user-land?
To answer this question we have to backtrack a bit to the SILO state structure. I mentioned the importance of the EtwpLoggerContext attribute to keep track of event tracing sessions so we can look at the values contained in the object to get a list of event tracing sessions.
lkd> dt nt!_ETW_SILODRIVERSTATE ffffe08d`a27e7000
   +0x000 Silo             : (null)
   +0x008 SiloGlobals      : 0xfffff800`7c9489c0 _ESERVERSILO_GLOBALS
   +0x010 MaxLoggers       : 0x50
   +0x018 EtwpSecurityProviderGuidEntry : _ETW_GUID_ENTRY
   +0x1c0 EtwpLoggerRundown : 0xffffe08d`a27e64c0  -> 0xffffe08d`a23fd5a0 _EX_RUNDOWN_REF_CACHE_AWARE
   +0x1c8 EtwpLoggerContext : 0xffffe08d`a27e6740  -> 0x00000000`00000001 _WMI_LOGGER_CONTEXT
   +0x1d0 EtwpGuidHashTable : [64] _ETW_HASH_BUCKET
   +0xfd0 EtwpSecurityLoggers : [8] 3
   +0xfe0 EtwpSecurityProviderEnableMask : 0x7 ''
   +0xfe4 EtwpShutdownInProgress : 0n0
   +0xfe8 EtwpSecurityProviderPID : 0x5b4
   +0xff0 PrivHandleDemuxTable : _ETW_PRIV_HANDLE_DEMUX_TABLE
   +0x1010 RTBacklogFileRoot : (null)
   +0x1018 EtwpCounters     : _ETW_COUNTERS
   +0x1028 LogfileBytesWritten : _LARGE_INTEGER 0x00000001`e16342f8
   +0x1030 ProcessorBlocks  : (null)
   +0x1038 ContainerStateWnfSubscription : 0xffff890e`06e5d3f0 _EX_WNF_SUBSCRIPTION
   +0x1040 ContainerStateWnfCallbackCalled : 0
   +0x1048 UnsubscribeWorkItem : 0xffff890e`06c392b0 _WORK_QUEUE_ITEM
   +0x1050 PartitionId      : _GUID {00000000-0000-0000-0000-000000000000}
   +0x1060 ParentId         : _GUID {00000000-0000-0000-0000-000000000000}
   +0x1070 QpcOffsetFromRoot : _LARGE_INTEGER 0x0
   +0x1078 PartitionName    : (null)
   +0x1080 PartitionNameSize : 0
   +0x1082 UnusedPadding    : 0
   +0x1084 PartitionType    : 0
   +0x1088 SystemLoggerSettings : _ETW_SYSTEM_LOGGER_SETTINGS
   +0x1200 EtwpStartTraceMutex : _KMUTANT
lkd> dq 0xffffe08d`a27e6740 (address of EtwpLoggerContext)
ffffe08d`a27e6740  00000000`00000001 00000000`00000001
ffffe08d`a27e6750  ffffe08d`a24e4040 ffffe08d`a2bee640
ffffe08d`a27e6760  ffffe08d`a24e2600 ffffe08d`a24e4740
ffffe08d`a27e6770  ffffe08d`a2be3700 ffffe08d`a2be5040
ffffe08d`a27e6780  ffffe08d`a2be5600 ffffe08d`a2be8040
ffffe08d`a27e6790  ffffe08d`a2be8600 ffffe08d`a2beb040
ffffe08d`a27e67a0  ffffe08d`a2beb640 ffffe08d`a2bee040
ffffe08d`a27e67b0  ffffe08d`a2bf1040 ffffe08d`a2bf1600
This gives us a list of _WMI_LOGGER_CONTEXT entries; inside we find a lot of information and we can immediately recognize some of it like the name of the logger and the file it is registering the telemetry in.
lkd> dt nt!_WMI_LOGGER_CONTEXT ffffe08d`a2bf1600
   +0x000 LoggerId         : 0xf
   +0x004 BufferSize       : 0x20000
   +0x008 MaximumEventSize : 0xfff8
   +0x00c LoggerMode       : 0x800002
   +0x010 AcceptNewEvents  : 0n0
   +0x018 GetCpuClock      : 1
   +0x020 LoggerThread     : 0xffffe08d`a3154040 _ETHREAD
   +0x028 LoggerStatus     : 0n0
   +0x02c FailureReason    : 0
   +0x030 BufferQueue      : _ETW_BUFFER_QUEUE
   +0x040 OverflowQueue    : _ETW_BUFFER_QUEUE
   +0x050 GlobalList       : _LIST_ENTRY [ 0xffffe08d`a3164038 - 0xffffe08d`a35c2038 ]
   +0x060 DebugIdTrackingList : _LIST_ENTRY [ 0xffffe08d`a2bf1660 - 0xffffe08d`a2bf1660 ]
   +0x070 DecodeControlList : (null)
   +0x078 DecodeControlCount : 0
   +0x080 BatchedBufferList : (null)
   +0x080 CurrentBuffer    : _EX_FAST_REF
   +0x088 LoggerName       : _UNICODE_STRING "FaceCredProv"
   +0x098 LogFileName      : _UNICODE_STRING "C:\WINDOWS\system32\LogFiles\Wmi\FaceUnlock.etl"
   +0x0a8 LogFilePattern   : _UNICODE_STRING ""
   +0x0b8 NewLogFileName   : _UNICODE_STRING ""

...
By using logman to query for a list of providers and some trial and error we find that not all providers can be enumerated from user-land. For example, the one shown above is not present among the ones listed by logman.
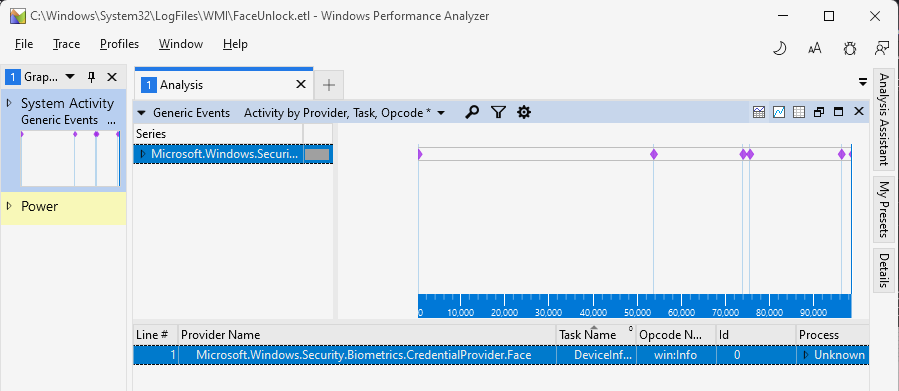
That said we can still open up the C:\WINDOWS\system32\LogFiles\Wmi\FaceUnlock.etl file in a utility like Windows Performance Analyzer to access whatever data the logger is registering.
Driver Callbacks
Driver Callbacks, or Callback Notifications, are used by kernel drivers to handle events about process and thread operations.
Whenever a new EDR driver loads, it implements and registers several functions to receive this kind of telemetry allowing the security solution to ingest data about system activity, process it, and execute procedures like user-land hooking on newly-created processes.
It's worth noting that since EDRs can be "blinded" by disabling their access to specific callbacks, a complex product will tend to combine several telemetry sources. For example, let's say we manage to prevent an EDR from accessing callback notifications about process creation with the objective of dumping LSASS's memory and extracting credentials from it; without the opportunity of hooking and monitoring calls to functions like MinidumpWriteDump it's still possible to monitor these events by looking at what these actions imply. Even if we have no clue whether a suspicious function is being called, we'll still see a process opening a handle to the lsass.exe process and it results in a file being written on disk; these alone might be clear giveaways that can be further analyzed.
These are some of the functions used to register routines (or procedures) that will executed at the time of a callback:
-
PsSetCreateThreadNotifyRoutineEx()for thread creation -
PsSetCreateProcessNotifyRoutineEx()for process creation -
PsSetLoadImageNotifyRoutine()for image loading -
PsRegisterAltSystemCallHandler()to intercept ALL syscalls
In order to register a function to be executed whenever an event is triggered, the driver's code will include something similar to the following in the DriverEntry function
// register the executeOnProcessCreation function to be run whenever a new process is created
// the second argument of the function is set to FALSE since we're registering the procedure, not deleting the existing one
// @reference https://learn.microsoft.com/en-us/windows-hardware/drivers/ddi/ntddk/nf-ntddk-pssetcreateprocessnotifyroutineex
NTSTATUS returnValue = PsSetCreateProcessNotifyRoutineEx(executeOnProcessCreation, FALSE);

if (!NT_SUCCESS(returnValue)) {
	// if PsSetCreateProcessNotifyRoutineEx fails to register the function
	// we call the same function again setting the second argument as TRUE to remove the existing procedure
	DbgPrint("[!] PsSetCreateProcessNotifyRoutine failed: 0x%08X\n", returnValue);
	PsSetCreateProcessNotifyRoutineEx(executeOnProcessCreation, TRUE);
}
The executeOnProcessCreation function can perform user-land hooking or something less complex like printing debug information
void executeOnProcessCreation(PEPROCESS process, HANDLE pid, PPS_CREATE_NOTIFY_INFO createInfo) {
	UNREFERENCED_PARAMETER(process);

	if (createInfo) {
		if (createInfo->FileOpenNameAvailable) {
			DbgPrint("[~] %wZ process created with PID %d\n", createInfo->ImageFileName, pid);
		}
	}
}
You can read more about the registration process here.
The Windows Kernel keeps a trace of the functions registered for callbacks in a structure called EX_CALLBACK_ROUTINE_BLOCK
typedef struct _EX_CALLBACK_ROUTINE_BLOCK {
    EX_RUNDOWN_REF RundownProtect;
    PEX_CALLBACK_FUNCTION Function;
    PVOID Context;
} EX_CALLBACK_ROUTINE_BLOCK, *PEX_CALLBACK_ROUTINE_BLOCK;
Driver Callbacks from an offensive standpoint
There are several known ways of evading and circumventing the checks put in place by the kernel; they can be effective in theory but, because of that, the API calls and functionalities used to set these techniques up are usually tightly monitored.
Let's take DLL unhooking from user-land as an example: one of the techniques used to remove hooks set by security solutions from DLLs like ntdll.dll is reading the same file from disk and mapping it in memory, effectively replacing the hooked version of the DLL with an unhooked one.
In order to achieve this we can use the CreateFileMappingA function
HANDLE CreateFileMappingA(
  [in]           HANDLE                hFile,
  [in, optional] LPSECURITY_ATTRIBUTES lpFileMappingAttributes,
  [in]           DWORD                 flProtect,
  [in]           DWORD                 dwMaximumSizeHigh,
  [in]           DWORD                 dwMaximumSizeLow,
  [in, optional] LPCSTR                lpName
);
When calling it, we can specify the SEC_IMAGE_NO_EXECUTE in the flProtect argument as it will not trigger the functions registered through PsSetLoadImageNotifyRoutine, loading the unhooked version of the DLL without generating telemetry about image loading.
...
Additionally, mapping a view of a file mapping object created with the
SEC_IMAGE_NO_EXECUTEattribute will not invoke driver callbacks registered using thePsSetLoadImageNotifyRoutinekernel API.
Another example of "evading" Driver Callbacks from user-land is using fibers to execute shellcode or payloads.
A fiber is a unit of execution that must be manually scheduled by the application. Fibers run in the context of the threads that schedule them.
Since fibers are handled by the user-mode application directly and not by the Windows Kernel, unlike threads, executing tasks from a fiber can be used to avoid triggering callbacks that would normally be generated upon creation of a thread. Thread creation telemetry itself can be bypassed with a technique like Pool Party injection since it uses an existing process' thread pool instead of creating a new one for injection.
One method to prevent EDRs from accessing Driver Callbacks from kernel-land is to find the entry of the registered procedures in the process callback array and overwrite the function pointer of the registered function with NULL bytes.
This can be demonstrated against a product like Sysmon: despite it not being an EDR, it still gathers data using driver callbacks registered from its SysmonDrv.sys. Once installed, the driver will be loaded and it can be listed among the active modules.
lkd> lm
start             end                 module name
00007ff6`d3110000 00007ff6`d3118000   EngHost    (deferred)

...

fffff803`84ff0000 fffff803`85060000   volsnap    (deferred)
fffff803`85070000 fffff803`8509e000   SysmonDrv   (deferred)
fffff803`850a0000 fffff803`850f1000   rdyboost   (deferred)
fffff803`85100000 fffff803`85127000   mup        (deferred)

...
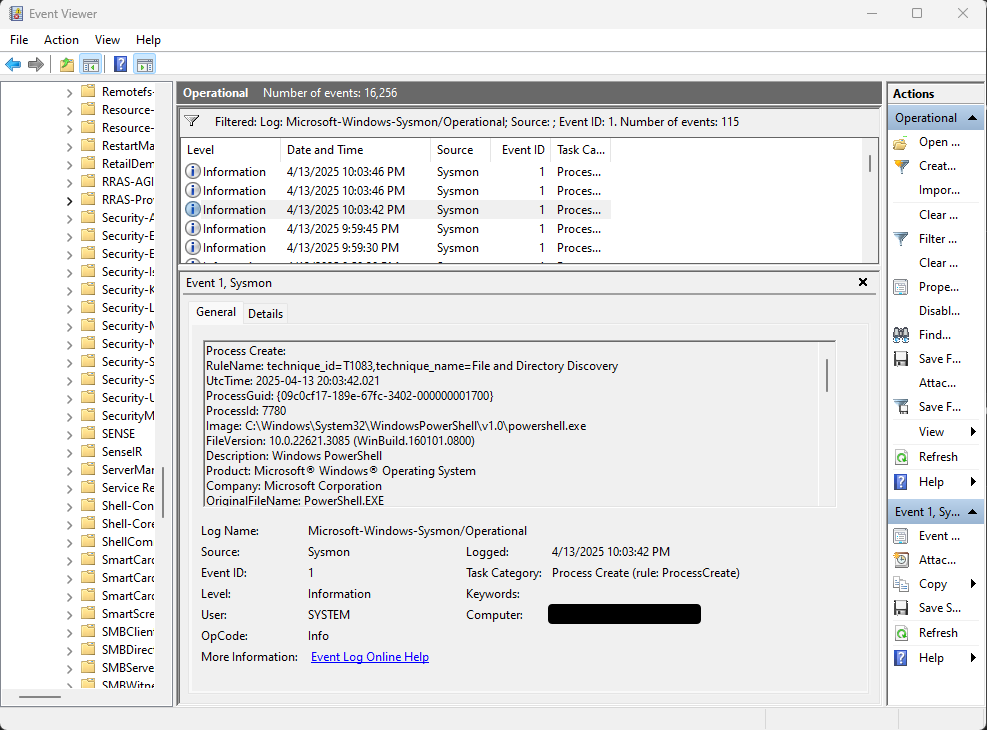
If we open EventViewer, navigate to Applications and Services Logs ‚Üí Microsoft ‚Üí Windows ‚Üí Sysmon ‚Üí Operational and filter for events with an ID of 1, which is assigned to process creation events, we'll see multiple logs about processes being created on the host.
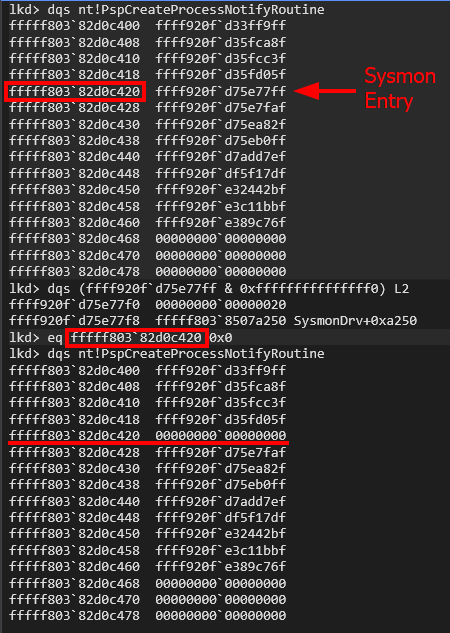
We will now modify the array where all the callbacks registrations are stored so that Sysmon is no longer able to retrieve information about process creation. The data we're looking for is stored in the PspCreateProcessNotifyRoutine array, which gets modified by the PsCreateProcessNotifyRoutine function when a new function is registered.
lkd> dqs nt!PspCreateProcessNotifyRoutine
fffff803`82d0c400  ffff920f`d33ff9ff
fffff803`82d0c408  ffff920f`d35fca8f
fffff803`82d0c410  ffff920f`d35fcc3f
fffff803`82d0c418  ffff920f`d35fd05f
fffff803`82d0c420  ffff920f`d75e77ff
fffff803`82d0c428  ffff920f`d75e7faf
fffff803`82d0c430  ffff920f`d75ea82f
fffff803`82d0c438  ffff920f`d75eb0ff
fffff803`82d0c440  ffff920f`d7add7ef
fffff803`82d0c448  ffff920f`df5f17df
fffff803`82d0c450  ffff920f`e32442bf
fffff803`82d0c458  ffff920f`e3c11bbf
fffff803`82d0c460  ffff920f`e389c76f
fffff803`82d0c468  00000000`00000000
fffff803`82d0c470  00000000`00000000
fffff803`82d0c478  00000000`00000000
Listing its contents will reveal several pointers to functions set to be executed in kernel-land when a process is created; by printing the symbols of the address a value is pointing to we're able to see where the registered function lives and which driver it belongs to.
lkd> dqs (ffff920f`d75e77ff & 0xfffffffffffffff0) L2
ffff920f`d75e77f0  00000000`00000020
ffff920f`d75e77f8  fffff803`8507a250 SysmonDrv+0xa250
To effectively "blind" Sysmon's SysmonDrv we can just zero out said address so that the function is not registered anymore, causing the driver to lose all telemetry on process creation.
eq fffff803`82d0c420 0x0
If you now start opening processes and refreshing the Event Viewer logs, you'll see that no more events with ID 1 will be registered. This will be true until the driver gets loaded back into memory (assuming it doesn't registers its callback procedure more than once).
Object Callbacks
Object Callbacks are similar to Driver Callbacks, but instead of generating telemetry for process / thread activity, they are tied to specific kernel objects and monitor operations made towards said objects instead. This kind of callbacks focuses on handling creation and duplication with specific permissions.
ObRegisterCallbacks is the function used by drivers to register callbacks that trigger on process / thread / desktop handle creation and duplication.
The addresses of the objects that have object callbacks registered on them are stored in the following table.
lkd> dq nt!ObTypeIndexTable
fffff803`82d1e670  00000000`00000000 ffffab00`7a5e7000
fffff803`82d1e680  ffff920f`cfadbd20 ffff920f`cfadb640
fffff803`82d1e690  ffff920f`cfadbe80 ffff920f`cfadb0c0
fffff803`82d1e6a0  ffff920f`cfadb220 ffff920f`cfadb380
fffff803`82d1e6b0  ffff920f`cfaff400 ffff920f`cfaff140
fffff803`82d1e6c0  ffff920f`cfaff560 ffff920f`cfafe0c0
fffff803`82d1e6d0  ffff920f`cfaffae0 ffff920f`cfaff2a0
fffff803`82d1e6e0  ffff920f`cfafe900 ffff920f`cfaff6c0
So instead of going over all the entries, we can find the EPROCESS address of a specific PID and just retrieve the _OBJECT_TYPE address for said process to look at what callbacks and procedures are registered for it.
lkd> !process 4 0
Searching for Process with Cid == 4
PROCESS ffff920fcfb51040
    SessionId: none  Cid: 0004    Peb: 00000000  ParentCid: 0000
    DirBase: 001ae000  ObjectTable: ffffc883e2e0d380  HandleCount: 6564.
    Image: System

lkd> !object ffff920fcfb51040
Object: ffff920fcfb51040  Type: (ffff920fcfadb380) Process
    ObjectHeader: ffff920fcfb51010 (new version)
    HandleCount: 6  PointerCount: 153019

lkd> dt nt!_OBJECT_TYPE ffff920fcfadb380
   +0x000 TypeList         : _LIST_ENTRY [ 0xffff920f`cfadb380 - 0xffff920f`cfadb380 ]
   +0x010 Name             : _UNICODE_STRING "Process"
   +0x020 DefaultObject    : (null)
   +0x028 Index            : 0x7 ''
   +0x02c TotalNumberOfObjects : 0x13d
   +0x030 TotalNumberOfHandles : 0xcfc
   +0x034 HighWaterNumberOfObjects : 0x14e
   +0x038 HighWaterNumberOfHandles : 0xf62
   +0x040 TypeInfo         : _OBJECT_TYPE_INITIALIZER
   +0x0b8 TypeLock         : _EX_PUSH_LOCK
   +0x0c0 Key              : 0x636f7250
   +0x0c8 CallbackList     : _LIST_ENTRY [ 0xffffc883`e92fc130 - 0xffffc883`e4bf0830 ]
When dealing with Object Callbacks, we'll encounter two types of operations / actions:
- pre-operation: procedures executed before an event (handle creation, duplication, ...)
- post-operation: procedures executed right after an event takes place
By querying the TypeInfo attribute we get a list of the registered procedures that will be called whenever a handle is opened, closed, duplicated, and so on but we find no information on whether these procedures are pre or post operation.
lkd> dx -id 0,0,ffff920ffd91a100 -r1 (*((ntkrnlmp!_OBJECT_TYPE_INITIALIZER *)0xffff920fcfadb3c0))
(*((ntkrnlmp!_OBJECT_TYPE_INITIALIZER *)0xffff920fcfadb3c0))                 [Type: _OBJECT_TYPE_INITIALIZER]

	...

    [+0x030] DumpProcedure    : 0x0 : 0x0 [Type: void (__cdecl*)(void *,_OBJECT_DUMP_CONTROL *)]
    [+0x038] OpenProcedure    : 0xfffff8038268bb60 : ntkrnlmp!PspProcessOpen+0x0 [Type: long (__cdecl*)(_OB_OPEN_REASON,char,_EPROCESS *,void *,unsigned long *,unsigned long)]
    [+0x040] CloseProcedure   : 0xfffff803827b3c00 : ntkrnlmp!PspProcessClose+0x0 [Type: void (__cdecl*)(_EPROCESS *,void *,unsigned __int64,unsigned __int64)]
    [+0x048] DeleteProcedure  : 0xfffff803827e7000 : ntkrnlmp!PspProcessDelete+0x0 [Type: void (__cdecl*)(void *)]
    [+0x050] ParseProcedure   : 0x0 : 0x0 [Type: long (__cdecl*)(void *,void *,_ACCESS_STATE *,char,unsigned long,_UNICODE_STRING *,_UNICODE_STRING *,void *,_SECURITY_QUALITY_OF_SERVICE *,void * *)]
    [+0x050] ParseProcedureEx : 0x0 : 0x0 [Type: long (__cdecl*)(void *,void *,_ACCESS_STATE *,char,unsigned long,_UNICODE_STRING *,_UNICODE_STRING *,void *,_SECURITY_QUALITY_OF_SERVICE *,_OB_EXTENDED_PARSE_PARAMETERS *,void * *)]
    [+0x058] SecurityProcedure : 0xfffff8038269fb00 : ntkrnlmp!SeDefaultObjectMethod+0x0 [Type: long (__cdecl*)(void *,_SECURITY_OPERATION_CODE,unsigned long *,void *,unsigned long *,void * *,_POOL_TYPE,_GENERIC_MAPPING *,char)]
    [+0x060] QueryNameProcedure : 0x0 : 0x0 [Type: long (__cdecl*)(void *,unsigned char,_OBJECT_NAME_INFORMATION *,unsigned long,unsigned long *,char)]
    [+0x068] OkayToCloseProcedure : 0x0 : 0x0 [Type: unsigned char (__cdecl*)(_EPROCESS *,void *,void *,char)]

	...
To find this information we have to look at the CallbackList field of the structure: a double-linked list used to store callback entries in the form of _CALLBACK_ENTRY_ITEM structures, similar to how ETW logging sessions are stored in hash tables containing linked lists.
typedef struct _CALLBACK_ENTRY_ITEM {
    LIST_ENTRY EntryItemList;
    OB_OPERATION Operations;
    DWORD Active;
    CALLBACK_ENTRY * CallbackEntry;
    PVOID ObjectType;
    POB_PRE_OPERATION_CALLBACK PreOperation;
    POB_POST_OPERATION_CALLBACK PostOperation;
    QWORD unk;
} CALLBACK_ENTRY_ITEM, * PCALLBACK_ENTRY_ITEM;
Here we see some important information like the Operations attribute; this attribute indicates the events associated with the callback:
- if the value is
0x1, the operation is executed when a handle is created (OB_OPERATION_HANDLE_CREATE) - if the value is
0x2, the operation is executed when a handle is duplicated (OB_OPERATION_HANDLE_DUPLICATE) - if the value is
0x3, a sum of the previous two, the operation is executed on both handle creation and duplication
Moreover, just like for ETW sessions, these callbacks have an Active attribute that determines whether the callback will be executed; this is another easy change an attacker could make in memory to disable a callback from kernel-land.
The PreOperation and PostOperation fields contain pointers to the functions we found in TypeInfo that will actually get executed before or after an event.
Registry Callbacks
Registry Callbacks, as you might imagine, are used to track registry activity; they are registered with the CmRegisterCallback function.
A linked list of these callbacks can be found by getting the address of the CallbackListHead symbol.
lkd> dq nt!CallbackListHead
fffff803`82c143e0  ffffc883`e4b8de60 ffffc883`ea2ae630
fffff803`82c143f0  00000000`00000000 00000000`00000000
fffff803`82c14400  01dbacac`65a70e04 00000000`00000000
fffff803`82c14410  fffff803`82c14410 fffff803`82c14410
fffff803`82c14420  00000000`00060001 fffff803`82c14428
fffff803`82c14430  fffff803`82c14428 00000000`00000000
fffff803`82c14440  00000000`00060001 fffff803`82c14448
fffff803`82c14450  fffff803`82c14448 00000000`00000001
To successfully parse this list we have to take a look at its structure
typedef struct _CMREG_CALLBACK {
    LIST_ENTRY List;
    ULONG Unknown1;
    ULONG Unknown2;
    LARGE_INTEGER Cookie;
    PVOID Unknown3;
    PEX_CALLBACK_FUNCTION Function;
} CMREG_CALLBACK, *PCMREG_CALLBACK;
So taking a look at the values above we can see that:
-
0xffffc883e4b8de60is the next entry in the list -
0xffffc883ea2ae630is the previous entry in the list -
0x01dbacac65a70e04is the cookie returned by theCmRegisterCallbackfunction to allow the driver to un-register the callback usingCmUnRegisterCallbackand the specified value -
0xfffff80382c14410is the address of the function that will be called when an event is triggered
To find the address of CallbackListHead in memory, it's possible to look at the instructions for the CmRegisterCallback and CmUnRegisterCallback functions, specifically where they load the address to CallbackListHead.
ē ‚ÄĘŠī•‚ÄĘ Ē

